Most companies are moving in too many directions, wasting precious runway on hunches. What if we told you the answer was a 16-row spreadsheet? Amazon, Google, Facebook, PayPal, Twitter – the world’s top tech companies each align around a North Star Metric and a few “key drivers” because that simple framework has incredible power to align and focus the team. Now you can get yours.
- Identify your “north star metric” to align the whole company around growth
- Map out your growth model and identify your key drivers
- Find your “rate limiting step” where you should focus for maximum impact
Slides
Worksheet
https://businessofsoftware.org/wp-content/uploads/sites/11/2020/10/Metrics-That-Matter-Worksheet.pdf
Transcript
Matt Lerner
All right, let’s share the screen here. I’m gonna go into Slack real quick. And then I’ll talk you through them at various points in here. But the first thing you want to do is grab a sheet of paper. Now there is one link I put in Slack, that’s a worksheet, we’re gonna fill that out, but it’s super simple. So if you want to download it and print it, you can or literally just take out a piece of paper and fold it in three, like you’re gonna stick it into an envelope and mail it somewhere.
Yeah, and before I introduce myself, I’m gonna tell you a story, a war story about a time when I worked at PayPal, in 2009 annual planning, and my boss came to me, the VP, and said: Matt, can you come up with the way to make as much profit as possible in calendar year 2009, we need to generate free cash flow. That was the instructions I got. It’s kind of funny, because free cash flow or EBITDA, that’s what the CEO is accountable to the board of directors for. I wasn’t the CEO, I was solidly four or five levels below the CEO and the company. So there were four or five layers of very well paid genius between me and the board of directors. And the best thing they can come up with was, can you go make us some money. Like that was the start and the end of the strategy as the best thing you come up with? I’d expect a little more. So I was in a marketing function, running marketing teams, I didn’t have any product resources. And when you onboard more customers at PayPal, it takes a while for them to ramp up to generate revenue, so it doesn’t really pay off in year. So I ended up doing a price increase, we made some changes down in the fee table stuff that most people wouldn’t notice, wouldn’t cause any one customer a lot of pain, but all together ended up generating an extra $30 million per year in profit for the company. So I was feeling pretty good about myself, right? 30 million times, we were selling it about 40 times earnings. So that’s about 1.2 billion in shareholder value created. But for those of you who are not students of the payment industry, and its illustrious past, you may not know but 2009 was actually a very momentous year in payment processing. So does anyone recognize these these kids?
We’ll turn on the chat. suspense is killing me. Yeah, it’s the Causton brothers. And they’re like 16, and 19, I think in this picture, and they founded stripe, Stripe, which is now worth $30 billion. And that’s $30 billion of serving customers who would have otherwise use PayPal. And then this guy here, I’m sure you recognize. This is Jack Dorsey. And he founded square. Again, like going after PayPal customers. And I knew right away the moment I saw this product, that it was going to be successful. And the reason I knew it was going to be successful is because our customers were calling us every day and asking us to build this product. And I know Henry Ford said: If I asked my customers what they want, they’d say faster horses. But in this case, our customers are calling us and saying I’m tired of typing in credit card numbers on my smartphone with my fingers all day, can you please make a magnetic card swipe reader that plugs into my smartphone for me. But we didn’t do that because Cost of Goods Sold low margin not interesting to pay out for, you know, reasons, financial reasons. So what PayPal did not do in 2009 was this $66 billion in shareholder value creation, because they weren’t listening to their customers. And they weren’t listening to their customers, because of their incentive structure. Because everyone in the company, at least down to my level was thinking about free cash flow, rather than thinking about what our customers wanted. So the punchline of all this, is you get what you measure, right? And so metrics have this incredible power to align and focus a team but it’s a double edged sword, because if you measure the wrong thing, it goes the wrong direction.
So Mark asked me when we did this talk, by the way, you guys might already know this. But you know, the way most people run events, Mark is a pretty special guy. To be blunt, just between us. You know, most people look at how many Twitter followers you have, and how much is your speaker fee and get a few famous people to keynote and recycle the same talks they give everywhere. And you know, Mark doesn’t do that. Mark and I spent hours on the phone talking about what content I could cover. He said: you know this audience is not marketers. You get one hour. First of all, it can’t be boring. And second of all, you need to give them something. The most useful thing you can give them in one hour that will help them improve their marketing. So I’m not going to talk about marketing all at all. I’m just going to talk about metrics.
So let me quickly introduce myself. And why do I know so much about PayPal? My name is Matt Lerner. And I worked in Silicon Valley for most of my career to startups you never heard of. One that some of the old timers in the group may have heard of is Elemental Software, they got acquired by Macromedia. And then after that, eventually I joined PayPal in 2004. Worked out for 11 years, saw a lot of growth. When I left Pay Pal, I became a partner with the early stage VC fund 500 startups. And for my education, that was incredible, because I went from being like a mile deep on like Hawking payments to businesses to being like a mile wide. Because I literally, in three and a half years as a VC, I saw 1000 pitches, I saw metrics from 1000 companies, and how the founders were thinking about the business and what their acquisition strategies look like and forecast and everything. And the thing that jumped out at me was, for the most part, most companies have absolutely no idea how to do marketing. And that was especially like shocking, because product has grown so much in the last 20 years, you know, we’ve come up with Lean and Agile and jobs to be done. Like, there’s all this incredible innovation and thinking. And marketing is still like the opposite of Lean, it’s still people making these big, expensive bets on very expensive hires, and cash and equity. And then they hire people, and they get giant budgets. And they hire agencies, and they pour money into Facebook ads, and rebrands. And you know, all kinds of stuff that doesn’t scale and has questionable ROI. And like, I know, there’s a better way to do marketing, because that’s how, you know the best tech startups in the world are doing it. So I founded startup core strengths, basically, to teach people how to do that. And I wrote it all my book. It wasn’t published by publisher, it’s just on my website, it’s free. So maybe that’s a warning. You may want to check it out. But I tried to detail the whole process there for people. But the one thing we can talk about in an hour that’s going to impact you immediately is metrics. So the question I have is: we all know that setting goals seems to magically cause success. But how does that work? Mechanistically? Does anyone know or one to explain?
No, not really.
Choosing Good Metrics.
Yeah, where the attention goes, energy flows, you look where you want to go, just like skiing or snowboarding. If you look there, you’ll go there. But not just sort of like magic. And I noticed that if I started measuring things, if you write down your goals, you commit, if you measure things, you tend to hit them. You control what you measure. But these are kind of all ways of saying if you set targets to hit them, but mechanistically the way it operates is: we work harder to reach a goal. We see that target, we work a little harder. But the truth is, you’re afraid of being embarrassed. So it sort of motivates you. So that’s a good one to focus on if you set the right targets.
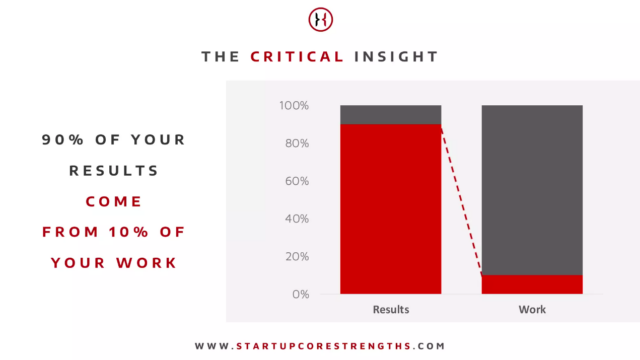
So Ben in the chat says focus limits options for our time. Right. It’s not just an incentive, but it helps us figure out how we’re going to spend our time because working harder by itself, doesn’t win. It wins. It’s great in sports, is great in like learning to play the cello. It does not work in business, right? Like how many employees does Jason freed, say you have 50 employees, right? So he’s trying to beat Microsoft with his left hand and Google with his right hand. He can’t outwork Microsoft and Google, not with 57 employees. And he said he only he likes to work 40 hour weeks, right. So the leverage is not hard work. Although it’s very helpful. The key is choosing to do the right work. So if any of you ever been in really successful businesses, and you’ll know, if you look back in hindsight, it’s obvious that 90% of your growth in customer acquisition came from like five things you did at PayPal, it was eBay and web developers and shopping carts and inbound and outbound sales. That was it. Is that all we did? No. We spent hundreds of millions of dollars on all this marketing stuff that didn’t work. But ultimately, all of our like real legitimate growth came from like 10% of the work. So for you if you don’t have all these resources in this giant corporate or even if you do, the goal is to find the right 10% as fast as possible. So that means that good metrics at each level in your company, help people make better decisions about which work they should do every day. Because strategy is what your company is going to do. But really strategy is what each person decides to do when they come in every morning and get to their desk, right? They’re gonna make decisions. And so you need them to make really good decisions.
PayPal’s Big Mistake
So the first thing I’ll say about choosing good metrics. I like Rich Mironov because he’s looked at so many companies, he talks about, like all the things you do wrong. So I’m gonna do that, too. Like the big mistake. And this was the mistake PayPal was making in 2009 is they were focused on profit is their main metric. And that’s a great thing to be accountable to the board for. But at some point below the board level, you then need to sort of figure out what are your trade offs to get there. So if you tell products and marketing smart, ambitious products, and marketing people generate revenue or profit in the first instance, they’re going to come up with all kinds of ideas that potentially degrade the value delivery to customers, you know, the orthogonal to, or degrade your customer experience, things like increasing pricing, or, you know, bundling and trying to increase average order size or making it hard to cancel your subscription. And that’s fine if you’re in a private equity fund, and you just want to flip something very quick profit. But fundamentally long term, if you’re trying to find product market fit. If you’re trying to build a unicorn, if you’re trying to be the next stripe or Uber, the only way to really get product market fit is to just absolutely nail value delivery. And speaking of product market fit, I will have a section at the end where I split out metrics, you should think about if you’re pre or post product market fit, because I know that’s a question that people have been asking.
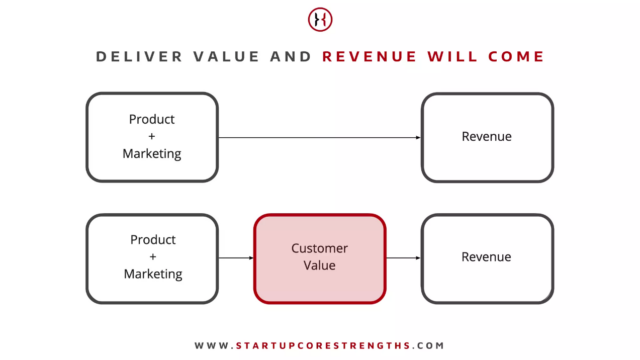
So if you want to charge these people in the first instance, drive customer value. And if you can do that, honestly, it’s not that hard to make revenue, like SAAS is not a super complicated business model. It’s pretty high margin. So like when I do workshops, with CFOs in the room, usually they’re the ones who are nodding most vigorously. The CFOs are like no product manager, you don’t worry about making money, you worry about making happy customers, and then money will happen.
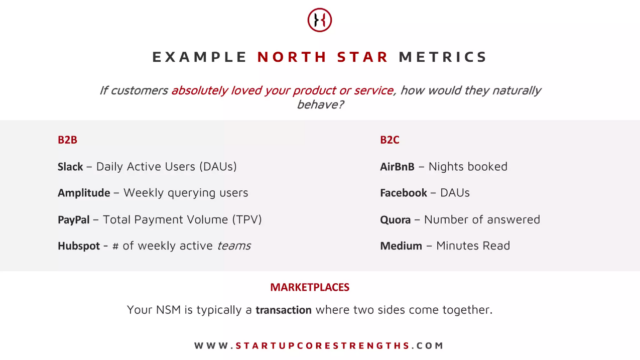
So that brings us to the next question, how do you measure customer value? I mean, for all its flaws, the nice thing about profits is assuming you’re not running Enron, it’s fairly straightforward to measure money, right? But value delivered will trickier. So we’re gonna go to our friend Bob Moesta, right? You remember, your customers are trying to make progress in their lives. And they’re hitting a moment of struggle. And that’s where you come in, and they hire your product to do a job to help them make progress in their lives. So if you’re helping them make progress in their lives, you’re delivering value. So then as you’re setting your metrics, you need to ask yourself, what measurable and we’ll go through this in detail, I’m just going to lay out the thinking first, what measurable customer behavior is the closest proxy for that value delivery? Then you want to know if my customers absolutely love my product or service, how would they naturally behave? What would they do? What does a happy customer look like? What percentage of my customers are behaving like that? Track it in cohorts and improve it over time. So at a high level summary, that’s trucking value delivery.
Applying this to Your Business.
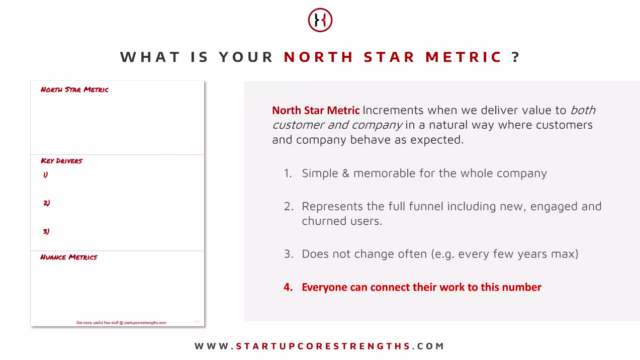
Now, let’s actually jump in and start to apply this to your business with this piece of paper. So I said folded in three. We’re going to start with the Northstar metric. And that’s basically the number and I’ll go through, we’ll work on your Northstar metrics in detail. But that’s the same question on the main number that’s gonna govern if you’re delivering value to your customers. But it’s usually pretty late in the funnel, so you can’t usually move it directly. So you’re gonna figure out what are all the things you could do to move the Northstar metric in the right direction, and then narrow down on like 1,2,3 of these that are rate limiting steps, but the most important area for you to focus in the next three months. And we’ll talk about how to find that. And then you’re going to also have these things, if any of you know Andy Y oung he coined this term, Nuance metrics, and these are numbers that it’s important to watch. But you don’t want to optimize. And we’ll talk about those in more detail too.
Want more of these insightful talks?
At BoS we run events and publish highly-valued content for anyone building, running, or scaling a SaaS or software business.
Sign up for a weekly dose of latest actionable and useful content.
Unsubscribe any time. We will never sell your email address. It is yours.
North Star Metrics.
So let’s start with our North Star metrics. This should be a number, which basically increments when you deliver value to your customer, and therefore your company is receiving value in a natural way where customers and company are behaving as expected. It should be a simple memorable number for the whole company. So don’t put all these like within 30 days, assuming they did this. I’m not planning just like, you know, seven following seven people in their first seven days on the product or whatever. So something simple and memorable. That represents the full funnel, including both new and engaged and churned users. This Northstar metric is called the Northstar because it doesn’t move even though the earth is turning around it. Amazon has had the same for their e commerce Business, the same Northstar metric since 1997. So if you’re changing this number a lot, you probably need to get a little clearer on who your customer is and how your business works. And then here’s the last part is the key. This is how you bring these numbers to life, everyone in your company should be able to connect their work to this Northstar metric. So you should literally be able to go through the company and each manager have a conversation with their each of their team members to say, once you know what the Northstar metric is, how does your work impact that number? What’s the work you do every day? And how does that impact the number.
So we’ll run through an example. And I’m picking on Balsalmiq. Because they were kind enough to sponsor the program. And they’ve got a fairly straightforward business model, from what I can tell I’ve not talked to them about this, I haven’t discussed this with them. I don’t know them. So hopefully this isn’t too far off the mark. But if I were king of balsamiq, and this is a tool for creating wireframes, in case you’ve not used it, SaaS tool, you know, obviously, I’m accountable to my investors, or my owners, or whoever for monthly recurring revenue. And that’s a function of the number of paying subscribers times the average plan cost, because they have three plans, 949 and 199. Well, the number of subscribers is going to be driven by weekly active users, which is retained from last week plus new. And then you know, there are some people who lapsed, but they’re still subscribers, but they’re not using the product. And then the new actives is going to be people will start from the bottom right, some traffic comes in, they create a trial account, they make their first wireframe, then maybe they make more wireframes and start to share it and play with the product a bit more. And then at some point, they love it. So they convert or they timeout, so they convert to a paid plan. And then you’ve got a new paying active user. So this is kind of roughly how I think their business works. I’ll open the chat so I can see what you’re saying. Where would you put your north star if you were the good people from balsamiq?
Now, Amazon’s Northstar metric, I will cover that later. It’s not 725 weekly actives. Did they already tell you guys this? All right. So making a wireframe may be value delivered. Most people make wireframes to share them with people. So it might be a sharing event. No, we’re just smart. Okay. But remember, you want something that encompasses the whole funnel. So I would probably put it in a number of wireframes made, you could do it around events, or you could do it around users, I think either it’s going to be one of those. And you can sort of build the funnel either way. In this case, I would go with weekly actives, because it’s a subscription retention business. And the total number of wireframes, you know, might be just get people who make more wireframes. But the pricing doesn’t really align exactly with the number of wireframes you make. So I’d want to know, there’s lots of people who are creating lots of wireframes. But you could go either way. But the point is, this is the right altitude, because if you go any higher, then you’ve got like average planning costs, he got some financial metrics. And if he goes any lower, then you’re kind of ignoring your back book of business and retention. So there isn’t necessarily a clear right and wrong on this. But I think it’s either going to be around wireframes or users just shouldn’t be too much higher or lower. So think about the question I have for you on the next slide is what is your Northstar metric, and I’m just gonna put up an Amazon’s is repeat transactions are repeat customers. I don’t know what Snapchat’s is.
So if you guys could just write down what you think is your Northstar metric. No breakout rooms or anything, you can discuss them later. And also any questions about the definition of a Northstar metric? I mean, for real with Snapchat, it’s probably like any social media, it’s probably daily active users. So the big point is that every team should be able to understand how they work impacts that metric. And if it’s high enough, like the weekly active users, how would a team that develops some parts of their system would understand the influence. Understanding the difference, the impact, like: Yeah, we did something and the number went up or you didn’t? Or it went down? Is it because of what we did? Or because other teams did like, how? So you’re in need of some metrics in between this perfect segue, you’ll need some metrics in between the Northstar metric in each person in the organization. Now, I’m going to talk this through for marketing, because I know the most about marketing. Hopefully, you can also find ways and tell me if there are ways that you would apply this, you know, through engineering, I think operations and customer service tend to work pretty well, as well. So your Northstar, remember is simply memorable for the whole company. It represents a whole funnel that doesn’t change, and everyone should be able to explain to you, even if they can’t measure it, you know, an engineer should be able to say, you know, I make this part of the product better. I know, customers like using that part of the product. Or the person who works on like, the share functionality. And balsalmiq should know that sharing your wireframes is a really important part of the workflow. And they want to make that easy for people.
Key Drivers of the North Star Metric.
So all right, so then the things that connect your work to that Northstar metric are your key drivers. Now, the key drivers should represent controllable customer behaviors. And you don’t want too many. You remember the balsalmiq chart right? There was like a huge list of possible key drivers. Excuse me, but you really only at any given time, assuming you don’t have a gazillion employees want to focus on a few of them. Your Northstar metric is usually going to be like a total number like daily active users or your number of queering teams per week. And you’re going to want that absolute number to go up. key drivers are often a ratio, what percent of people who signed up for a free trial actually created their first wireframe, what percent of people who visited the site registered for a free trial. And then I like to just have each team revisit the key driver focus every three months, I think Jason freed would do it every six weeks. I think that the takeaway there is if your company can be run by DHH, and Jason freed, then just let them run it, no worry about it. But for the rest of us. Anyways, the important point in the slide, though, is that every one of these key drivers should have a person’s name next to it. And that is not the CEOs name someone else in the organization. And in the valley, we would have referred to that as having one throat to choke. But a polite way to say it would be a single point of accountability. So Pay Pal’s Northstar metric on their good days when they’re behaving themselves was total payment volume. And the two main levers were ubiquity and preference. So be everywhere that a transaction is happening. It makes sure that consumers choose you every time they have the opportunity. And now you can imagine the levers if you want to be everywhere you’re selling to all the E commerce sites and trying to be on the shopping cart platforms. And you can imagine some of the levers on do that. Amazon from the 1997 shareholder letter from Jeff Bezos repeat purchases, the levers of price selection and convenience. And you can see right I was I was pretty ruthless about this focus, right? What do their delivery trucks look like? They look like people’s cars full of stuff, full of boxes. What does the website look like? It looks like dogshit. They don’t care. Right? If it’s not price selection, convenience, is not a priority at Amazon, right? Facebook, daily active users, and they do it across the universe? And then by product under that, and then that’s going to be how many people are signing up? And how how many of them are using it daily active? And how can we get them back in there. And then what brings them back in? Are these invites and follows and post count and things like that.
Rate Limiting Steps
So, then you’re gonna map out your key drivers and the main ones. But then as you’re thinking about it, keep asking yourself, what’s the rate limiting step? Now, this is an idea from operations management. If anyone ever had the pleasure of reading, you know, Eli Goldratt’s theory of constraints. The idea here is that in any system, the throughput is going to be governed by the narrowest point in the system, the bottleneck. And if you apply resources to that bottleneck, it makes everything else go better and faster. And if you apply resources anywhere else, then you’re wasting resources, you’re pushing string. So the way to think about finding your rate limiting step is just to start asking yourself, okay, if our retention is terrible, there’s probably not a point in spending too much money acquiring more customers, right? Or our retention is really good, but in our conversion rate on our website is really good, but we don’t have a lot of traffic. Okay, then maybe your rate limiting step is traffic. Well, most of the people that come to our site bounce and don’t sign up for a trial, then maybe your rate limiting steps your conversion rate, so have this conversation with your leadership team. Look at your metrics. So write down what you think are your most important key drivers now, but then go back and think about your rate limiting step.
Now I’m going to pause, answer questions and let you do that. And then I’m going to talk specifically about retention metrics. Because that’s kind of a tricky animal that I think a lot of us deal with, judging by the polls. So any questions?
Mark Littlewood
And there’s a question from Ray. Go for it. Ray.
Question from Audience
I had a question, driving down your balsamiq example of the Northstar metric. It seems like the value delivery metric is much more about the use of the wireframes. But then you are pushing back on that a little bit with what actually is driving the bottom line of the business, which is not the same as value delivery metric. So I was wondering what thoughts you had on how to be thinking about the intersect between these two, or whether it should be more focused on value metric? Or whether there should be a bigger accounting for how it drives the economics of the business?
Matt Lerner
I guess it’s splitting hairs. But I think it’s still a value delivery metric. It’s just how many people are you delivering value to? Rather than, you know, how much value are you delivering to each person. It creates a different incentive structure that is more aligned with the business, which is fine. But ultimately, you can’t fake it right, you’ve got to get more value to more people. Now, still, the people within your base who create more wireframes are going to be on a bigger plan, they’re going to be paying a bit more. So the incentives are aligned that way as well. But in this case, you know, I’m assuming that they’re looking at a number of customers is their kind of main growth driver. Now at PayPal, it was the opposite of that, like a big PayPal customer was literally worth 10,000 times more than a small PayPal customer. So, you know, we were way more interested in getting, you know, large customers on average than number of customers on the seller side.
Want more of these insightful talks?
At BoS we run events and publish highly-valued content for anyone building, running, or scaling a SaaS or software business.
Sign up for a weekly dose of latest actionable and useful content.
Unsubscribe any time. We will never sell your email address. It is yours.
Question from Audience
Okay, if I could just do a very quick follow up then using the Pay Pal example, if they were overly financial. If you had the ability to transport back 11 years in time and be in front of the board. What would you tell them they should be driving their Northstar to be down to from a value point of view if they were too far up on the financial aspect before?
Matt Lerner
Well, I think that the doorstop Northstar metric they were behaving well was, you know, total payment volume, which is how transaction minds run through this. And of course, PayPal makes most of their money as a percentage of the transaction volume. So customer and PayPal ends up pretty well under. I mean, if you’re interested in the minutiae of it, the reason they got so wrapped around the axle with profit margins is they were owned by eBay. And eBay was an insanely high margin business. And as PayPal’s revenue increased, and PayPal had like processing costs and fraud losses, PayPal had lower margins. And so overall, it was hurting the, you know, the the top line margin number. And instead of preparing shareholders expectations that were taking growth at the expense of margin, they decided to, you know, focus mostly on slower growth and higher margin products.
Question from Audience
Thank you. Sure. All right.
Matt Lerner
And even your point about margins can be a dangerous metric. Most of the great unicorn startups these days are getting their evaluations off the back of top line revenue growth rates rather than gross margins. People don’t worry too much, like HubSpot could become profitable. If they want to, if the SAAS business, they’d rather see top line growth. Alright, so let’s talk about retention because that’s a tricky one. And then the poll I did in Slack. It seemed like a lot of people on this call have got retention businesses. So the first thing is, I think, as a VC when I was an investor, everyone would talk about your 30 day retention rate, your 90 day retention rate. And that actually really doesn’t matter. If you look at people’s 90 day retention rate without getting too much confidential data. If you look at all the business accounts, you sign up, all the people who sign up for a PayPal business account. After 90 days, less than 5% of them are transacting. If you went to an investor and said I have 90 5%, three months churn, you’d have a real hard time getting a second meeting with that investor, clearly Pay Pal his business is doing okay. And that’s because it’s not a question of the number of customers, it’s, you know, the amount of transaction volume and a small number of really big customers make most of their revenue. But the point is, the absolute numbers themselves don’t matter hugely, what matters is the shape of the curve. So if you have a bunch of cohorts, and they all start is active, and all go to zero, these are each activation number of actives in a cohort. And by the way, I got this illustration from by Brian Balfour, just to give credit where I’ve stolen it from. Now, if you have the same business, only your activation rates are your retention drops off but flattens out. So the retention curves flatten, then your business looks like this. So the super important point here is don’t get super wrapped around the axle, about the overall retention rate until you flatten out the curve.
Habituation Thresholds.
Okay, now, how do you flatten out the curve? How do you improve retention? Well, we could obviously spend the whole rest of the conference talking about retention tactics, and I’m not going to, but I’ll keep it around the topic of metrics, because this is a really tricky metric. But let’s think it through from first principles again, okay, so I’m a designer, product manager, and I’m working on a small team, and I want to make some wireframes. And if someone tells me balsamiq’s good for that. So I go on, and I create an account, I try it, and I start making wireframes. So remember jobs to be done here. I’ve got a job on trying to hire balsamic for I get to their homepage. Someone told me it’s good for this. I get to their homepage. I think it’s good for this. Is that enough to cause retention? No, because I haven’t actually tried it yet. Right. So I go in, I log in I confirm my email address. Will that cause retention? No. Okay, I create my first wireframe. And it’s easy. Will, that cause retention, maybe, okay, what if I create five wireframes in the first seven days, and I share them with 11 people? Okay, clearly, I’m getting value out of balsamic. So my likelihood to retain is pretty high. And if I churn, it’s probably not because I found a better wireframe tool it’s probably because I stopped needing to share wireframes, I lost my job or something. So what I’d say is, how would people naturally behave if they loved your product? And then what early life behavior pattern predicts retention? So how far into your funnel they have to get before they feel the magic, and realize your product is going to do the thing they hired you to do?
So figure out what that threshold is. And you can do, I don’t know the name of the statistical analysis, if someone does put it in the chat, but basically, you want to take each sort of behavioral threshold point, and then say, does that predict retention? So Netflix did this, they said of all the people who created Netflix accounts and making up the numbers, but direction accurate of all the people who create a Netflix account in the early days, 40% of them were active after 90 days, of all the people who created Netflix account and added three titles to their queue 80% were active. So they did figure this much out, this is public. That if you create an account, until you add at least three titles to your your Netflix queue, that’s the aha moment when you’ve got value. So then they focus all their efforts on getting people to add titles to their queue. So figure out for you, what is that? You know, for Twitter and Facebook? You know, it was like following 10 People in seven days or having seven friends in three days, things like that. So what is yours like? What do you think is your habituation threshold? And then you just validate that analytically and say, okay, in past cohorts, people who have had this sequence of behaviors, what is their retention rate compared to regular signups? Yeah, it might be a regression analysis. Okay. Good to know. Thank you. So that’s where you start with metrics. Now the neat thing is once you’ve done that, you can go back to your investors and you can say, here’s our total MRR, here’s how much of our MRR is happy MRR from customers who we know are habituated and likely to stick around. Here’s how much of our MRRs from brand new customers we’ve just signed up. And here’s how much of our MRR is from lapsed customers who you know, haven’t been using the product, but they’re still paying for it. So that’s at risk MRR right. And that’s a great perspective to have on your business.
So Tim, yeah, the point of these graphs, this is a theoretical exercise. These are made up numbers, but I’m just saying, if all your customers churn, or almost all your customers churn, it’s very hard to grow a business. If some of your customers stick around even five or 10% of them like we had at PayPal, it looks very different. And the other thing, the merchants who did stick around and keep using PayPal, they would actually grow. So on a revenue basis, the cohorts would actually become more valuable. It was kind of inverse churn. It was like a J shaped curve. So, you know, for balsalmic? I don’t know. But where do we think their habituation threshold is? How far do you need to get in this funnel? Before you feel the joy? Or if someone on balsalmic wants to share that information? I won’t be offended, or I’d be delighted actually.
Yeah, I think making your first wireframe alone doesn’t tell me but if they’re actually showing it to a designer, or a customer, or a boss or something, to me, that feels like it’s somewhere in here. And it’s probably a little more nuanced than that, you know, it’s probably at least one wireframe shared with at least one person in 48 hours or something like that. And then when you want to move that metric, you can look at everything from, you know, traffic quality to onboarding, experience, all sorts of stuff, you know, out of box experience, all kinds of levers to start to move that. Because it could be traffic quality, right? There might be people who just only need to make one wireframe ever. Okay, well, then maybe we need to change our marketing mix and get fewer of those people.
All right. So think about what are your key drivers? Think you’ve already started, write those down? Which one’s your rate limiting step? If you’ve got a habituation threshold, you know, where are you going to look for that? And then, if some way you need to make a decision, whose name goes next to these metrics? So this is the end of key drivers. Before I go to nuance metrics, are there other questions about Northstars? Or key drivers? I’m trying to rush through this, so I apologize for the speed, I just find the questions and discussion on these things are really good. So I’m also trying to get to the group, but happy to answer questions as we go.
Want more of these insightful talks?
At BoS we run events and publish highly-valued content for anyone building, running, or scaling a SaaS or software business.
Sign up for a weekly dose of latest actionable and useful content.
Unsubscribe any time. We will never sell your email address. It is yours.
Nuance Metrics.
All right. So the nuance metrics, I won’t spend a lot of time here, you don’t need to fill these out now. But if you can think of any numbers that are like a good check on the things you’re maximizing. So for example, if I’m trying to get more signups, I might want to put a check on activation rates to make sure they’re good quality signups and I might want to put a check metric on cost per acquisition to make sure we’re not overpaying for them. If I’m trying to change the product to make it more sticky, I might keep an eye on net promoter score to make sure we don’t piss anybody off. So these are like the other numbers or you know, maybe seasonality is a big factor in your business. So you have a nuanced metric in there. So these are the things that inform these can be key drivers you’re not working on, or things that inform movements in the Northstar. So as you start to track your metrics and play with them, you’re just gonna see it as a bunch of other numbers, you need to keep an eye on, put them there. And the important thing about that list is: you want to keep an eye on them, who you’re not trying to maximize them. And that brings you to the sort of focus and discipline, because it’s really hard to look at a number and know that it could be better. But that right now you’ve got another priority, a more important priority. Another good nuance metric could be your traffic mix. There’s a lot of times like paid versus referral versus affiliate versus organic, they behave differently. So like what percent of your traffic is coming from paid, for example, could be an important nuance metric. All right. Any questions about nuanced metrics? I will jump into product market fit.
Backstops? I don’t know what that is. I’m sorry.
Question from Audience
The point I’m making is, I think you made the point, right? Like we don’t inadvertently affect another critical metric just for the sake of optimizing for one particular one. So the backstop means that you keep track on that other metric.
Matt Lerner
So what I’m calling a check metric, okay. Yeah, exactly. Yeah, thank you. Should nuance metrics be assigned normally, in a operating review or your meeting, you’re going to see them all there on the screen. So everyone should be monitoring them. So the way I’d incorporate this, everyone kind of has a look at these metrics, once a week, or every two weeks or whatever the cadence is to see how it’s going. But assigning the KPIs gives you an accountability. By the way, a lot of people like to sort of automate pulling these numbers into a dashboard. I recommend doing it manually. Just because there’s something really valuable to spending like 20 minutes on a Monday morning, actually a person looking through your numbers and looking through your analytics tools that causes Good thinking. All right. Are these normally done per company or per product? It depends on the complexity of your business. And it can be layered, right? You can have products like I’m sure Amazon has an Northstar metrics for AWS and there are other products too. But it sort of created, it focuses on the level at which you want to create the alignment. But ideally, your Northstar metric is as high and grand as possible.
Product Market Fit.
All right, so if you don’t have product market fit, quick definition of product market fit: if your product is broken, and people are still using it, if you have high retention, with a broken product, that’s a clear sign you have product market fit. When people ask me, I usually say if you’re not sure you don’t have it. If there’s time to the end to have a broken product story from PayPal, that’s kind of fun. We might get into but we’ll see. So if you don’t have product market fit, or you think you don’t, basically, here’s how it breaks down. All right, this is your time, energy and resources on the Y axis. And then the X axis is like how far along you are. So if you are pre product market fit, you’re hunting for product market fit. If you have product market fit, you’re Blitzscaling. This is the sprint and this might be 60:40, or might be 90:10, or 70:30. But you’re trying to maximize your current growth vectors, which could be vectors, I’m being really vague. It could be partnerships, it could be product driven growth, it could be a marketing channel, it could be a sales channel, like whatever access to you’re growing on. And then also you want to seek adjacent vectors that you can grow on at the same time. Now, and then, like when you’re a big giant company, you’ve got you know, Google, and then you’ve got like Google Labs trying to invent new stuff, right, but we’re not worried about that. But here’s the thing is really important. Because if you try to scale and you pump resources into scaling, when you don’t have product market fit, you’re basically accelerating your burn rate, you’re shortening your runway, and product market fit the search is a journey of indeterminate length. So you need time as your friend. So you do not want to be doubling down on expensive things, making your codebase more complex, make your interface more complex, until you find product market fit. So 100% of your focus is finding product market fit, how do you measure that?
Basically, you’re going to be running some kind of learning loops. Some you’ve got to basically be learning, start by learning about the problem space, validating the need. And then you know, a good product person will do build, measure, learn and test prototypes and wireframes. A good marketer is going to look for language market fit, or a salesperson, they’re going to be just putting out proposals propositions for non existent products in front of people and seeing if they click Buy, they’re going to start having conversations, preliminary discussions with prospects and see does this feel easy to sell.
So strength of fit metrics are things like conversion rates, activation rates, something that tells you like, Yeah, this is pretty easy to get people to start using this product. They’re telling their friends about it, retention rates. So these are more like qualitative metrics inside your funnel, to see how hard or easy it is to get people like bought into this and using it and running. And then the second metric, this is important for everyone that critical for product market fit is a metric around the pace of learning how many experiments you’re running per week. And now it feels like that’s weird, that creates this weird incentive that you’re just making up random experiments just to try stuff. That’s actually good. Because sometimes that random experiment that was on the bottom of everyone’s list, but you can do it quickly, and you got to hit your target ends up teaching you something really valuable. So the second pre PMF metric is the pace of learning. So that’s product market fit.
So the last thing I’m going to talk about is the process to then sort of perfuse these metrics for your organization, help everyone make better decisions about the work they do every day. Are there any sort of definitional questions around the metrics themselves? First, Northstar, key drivers, rate limiting step, retention threshold? All right, and how am I doing on time?
So for me on product market fit, there’s an idea called the forfeits framework, which basically says: fit has got to be locked in four places. First of all, you got to validate the need, and you need problem solution fit right? So first, is there like a really big good burning need? And then second of all, does your product solve that need? Okay? Then you need sort of language market fit, which means okay, you’ve got a product. Can you show some sales or marketing presentation or content to a customer and convince them this product is going to solve their problem? And as a marketing coach, so many of the companies I deal with have a great product, but they can’t explain it to anyone, so people don’t sign up. So getting that language market fit is the missing piece. And then the next feature you need is channels, you’ve got to figure out where you’re gonna go find those customers, whether it’s, you know, through some kind of product driven referral growth, or inbound or paid or whatever. And then the last piece is business model fit. So can you do this all in a way where you can actually monetize it? And so that money feeds back into the system and keeps the feedback loop going.
Want more of these insightful talks?
At BoS we run events and publish highly-valued content for anyone building, running, or scaling a SaaS or software business.
Sign up for a weekly dose of latest actionable and useful content.
Unsubscribe any time. We will never sell your email address. It is yours.
Question from Audience
Are there any company examples where a Northstar metric was not sufficient?
Matt Lerner
Yeah, there’s a few I mean, Facebook’s a good example, because the Northstar metric is all about user engagement. And obviously, they’re very good at selling advertising too. So they must have some metric on the advertising side, which is, frankly, you know, a conflict with their Northstar metric of daily active users. Because if you stop the newsfeed full of irrelevant ads, you’re going to be great experience. And Facebook doesn’t do that, and somehow reconciles that and gives the grayed out experience. Another example is Amazon, like they have more than one because they have AWS, which is a completely different business from their e commerce business.
Alright, let’s talk about bringing these metrics to life. So here’s how you run the process of the backhand east. Right? The point of this whole process is to help people at each level of your company, make good decisions about which work they choose to do. And your goal is to get everyone doing the most impactful work every day, I wake up, I open my laptop, what am I going to do that’s make or break for your company? Therefore, first thing is everyone should be able to just tell you, even if they don’t have metrics, here’s how the work I do impacts our Northstar metric, they should just understand that mentally in their heads. Don’t tell them, ask them. Because when you ask someone, how does your work affect the Northstar, you’re going to learn a lot. You’re going to learn if they understand the business or not, you’re going to learn if they can make strategic decisions at their level in the organization or not. And that’s super helpful. And they might know more than you do. And that would be great. Because then you’ll learn something, something other than the fact that you need to replace your employee. So then this empowers people to make good resource allocation decisions at their level and their domain of control. So Steve Jobs had a great quote, he said: We don’t hire great people and tell them what to do. We hire great people so they can tell us what to do. So here’s a chance to find out if your people can make good decisions and tell you what to do. So then it becomes this conversation about: remember the Northstar metric, what’s the most important work you’re doing? And how’s it going? I think that’s another place where we get sidetracked. When I was at PayPal, in the early days, they only hired I think, other than me, people out of Stanford. So I was kind of the dummy, Miami of Ohio person there. But all the Stanford people around me their quarterly or their weekly status updates. They did like 48 things. It was like a contest to see who could have the most bullet points of things they did that week. And the truth is most of the stuff you do every week doesn’t matter. So the conversation you want to have with each employee on your regular cadence is what is the most important work? And how’s that going? And that can be an ops review with the vice president that can be a one on one a weekly check in with your boss, what’s the most important work you’re doing? How’s it going? And how can I help? Because that forces the conversation about which work should we be doing? And is the important work getting blocked or moving forward?
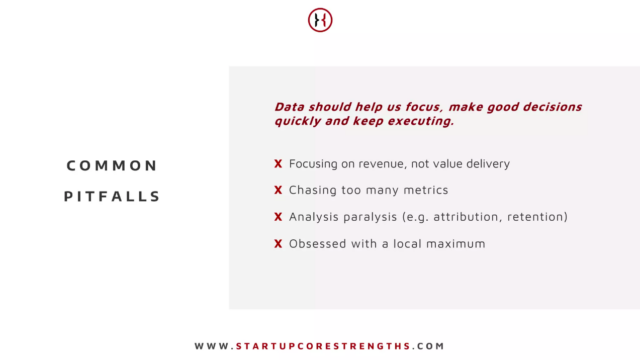
Recap and Common Pitfalls.
Quick, common pitfalls I see. We beat this horse to death, focusing on revenue or value delivery, chasing too many metrics at once. Huge problem, analysis paralysis. So as an investor, I saw this a few times where I would invest in absolutely brilliant founders. And then they’d spend six weeks debating what’s the Northstar metric. And the problem actually isn’t a metrics problem. There’s like a huge company culture problem, because they spend six weeks debating everything. And what you need is people who just make decisions and closest, you know, close Done is better than perfect. Let’s move ahead. So if you get into analysis paralysis, that’s a huge warning light in your business, you definitely need to get out of that. And that’s a cultural thing is not just metrics. And then yeah, someone called out the local maximum. So just, you know, come up with a monthly or quarterly cadence of like zooming out and saying, hey, you know, is our thinking to focus? Should we choose a different target? Should we step back and focus less on doing and more learning and try to come up with a better approach? Are we missing something bigger? All right, so to recap, and then I’ll open it up for questions.
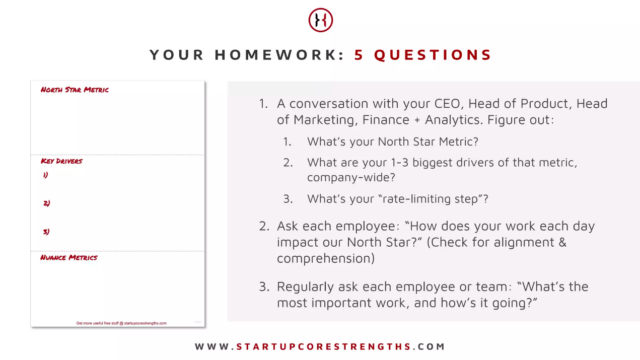
Come up with the Northstar metric, measures value delivery and is costing over time, focus on one to three key drivers, especially your rate limiting step and have people align their work to those key drivers. To make the Northstar metric go up, revisit that every three months. If you’re a pre product market fit, focus on learning about the product the solution, you know the need in the market, that channels the message proposition, the features. Focus on learning and try to iterate and learn as fast as you can. For retention, make sure you figure out where’s your habituation threshold? And then optimize? How do you get more people across it? So weirdly, solving retention actually kind of paradoxically becomes an activation problem. One person accountable for each key driver, and then your conversations with employees. Do you understand the Northstar metric? And how do you impact that number? Works for operations, works for sales, works for product works for everybody? Do you understand your key driver? How you move that? And then see, are you able to make good decisions about which work you should do based on that information? So your homework should you choose to accept it? Have a conversation with your leadership team, figure out your Northstar metric, and your key drivers and your rate limiting step? have these conversations with your employees? And then regular conversations, what’s the most important work you’re doing? And how’s it going? So that’s all I got. I’ll just leave you with Measure twice, cut once. I’m happy to take any other questions. Don’t know how much time we’ve got.
Want more of these insightful talks?
At BoS we run events and publish highly-valued content for anyone building, running, or scaling a SaaS or software business.
Sign up for a weekly dose of latest actionable and useful content.
Unsubscribe any time. We will never sell your email address. It is yours.
Mark Littlewood
We’ve got a five minutes or something? I guess we can tie it up. But there’s again, another session here that raises more questions than it helps focus a bunch of things. But you know, like a lot of these things, there’s an: Oh, my God, what does that mean for me? And so we’re gonna have to get you back to do a follow up later in the year if that’s alright,
Question from Audience
If you understand your key drivers, why would you need it revisiting so often?
Matt Lerner
So you’re going to have a lot of key drivers, what you’re going to revisit is which ones you’re focusing on? So given limited resources, where is your bottleneck in your system? Where should you focus which key driver in a three month period? If you’ve got a pretty big team, and you conduct teams against all the key drivers, and your product team can keep up with that? That’s good. All right.
Question from Audience
How often do you see this done and wrong? Maybe not catastrophically, but slowing creeping death?
Matt Lerner
I’m sorry, do you mean people who try to apply this framework and apply it badly? Or do you mean people who are dying because they’re not applying the framework? I mean, most people do not apply the framework, is the bottom line. And you know, some people get by, it just seems to work a lot better. I mean, I think if I were to just start surveying, and say: What is your company scaled up? What is your biggest hassle? A lot of them say people. And, you know, people are not aligned. And people don’t have a sense of ownership and people aren’t making good decisions. And you know, there’s always disagreements between people. And the system like this is designed to cause people to have conversations and get more aligned. So if nothing else that, you know, it’s hopefully going to make the people side of the business a little bit easier, in terms of like people who actually use the framework and screw it up. That’s these common pitfalls. And the the real dangerous one is analysis paralysis. How do you set a Northstar that isn’t easily tainted or gamed that’s where you want to have your check metrics in there. So just put some numbers around that sort of track the gaming of it. But the other thing, like hopefully, if your company is not that big, like you’re just sort of kind of paying attention. Having conversations. You guys all seem like pretty thoughtful people who stress test stuff pretty well. The right way, Northstar key drivers strategies OKRs Yeah, that’s it and for your OKRs then I’d ask your people.
Question from Audience
Is this the right order: Northstar, key drivers, strategies, OKRs?
Matt Lerner
That is correct. And for OKRs, I would ask your people I’d say here’s the Northstar, here’s the key drivers, you’re in charge of blah, blah, blah, what should your OKRs be? You tell me what work you should do. And then see what they come back to you with as a starter for 10. And then that conversation about: oh, I’m surprised why did you choose this? Oh, I chose it because blah, blah, blah. Well, maybe they’re missing an important piece of information and they’re making a bad decision. Or maybe you’re missing an important piece of information, and they’ve actually made a good decision. So that can be a really helpful conversation that OKR setting.
Question from Audience
The biggest driver on usage is number of customers. Is there another way to think about this?
Matt Lerner
Number of customers. What’s your business? It’s hard to say. I mean, you want to get lots of customers. And so you need to get people to experience the joy of having their job done by your product.

Matt Lerner
Founder, SYSTM
Matt Lerner is a bestselling author and 15-year Silicon Valley veteran, and three-time BoS speaker. Matt was part of the early growth team at PayPal, and a Partner with the VC fund 500 Startups.
Since founding SYSTM, Matt has worked with over 200 seed-stage startups to help them develop and execute their growth strategies.
He’s been featured in the First Round Review and the Harvard Business School podcast, and he’s guest lectured at Stanford Business School.
You can check Matt’s talks at BoS here.

Want more of these insightful talks?
At BoS we run events and publish highly-valued content for anyone building, running, or scaling a SaaS or software business.
Sign up for a weekly dose of latest actionable and useful content.
Unsubscribe any time. We will never sell your email address. It is yours.