- Product Pricing
- Some Economics
- Pricing Psychology
- Pricing Pitfalls
- Advanced Pricing
- What a Price Says
- Pricing Checklist
- Bibliography & Credits
To understand product pricing, it helps to understand some, but not too much, economics. The easiest way is through a simple example.
Let’s say you’ve just launched the Time Tracker 3000. It’s a download- able piece of software that logs which applications you use throughout the day, and sends the usage information back to a central web site. From there, you can find out what you’ve been up to all day long. You’ve decided to charge a one-off fee for it. Further on we’ll talk about web apps, social networks and other pricing models, but we’ll keep it simple for now.
How are you going to price it?
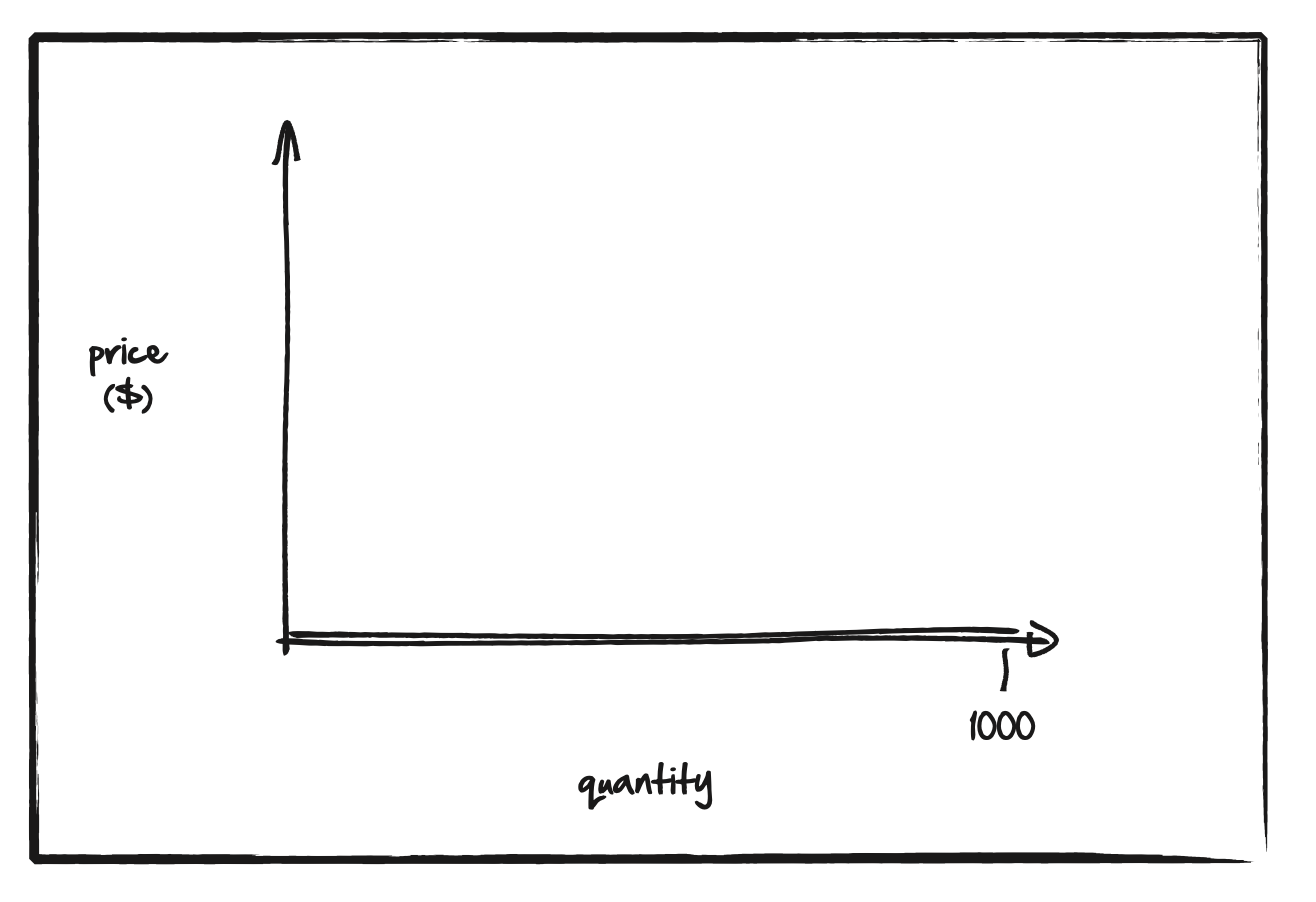
If you give it away for free, you’ll get lots of customers. A thousand, say, including Belinda the bargain hunter, Stewart the student, Willhelm the web start-up founder, Pat the product manager and Ernest the enterprise developer.
Let’s represent these thousand customers, paying no money, as an infinitely thin horizontal bar (representing the $0 price), 1000 units long (representing the quantity):
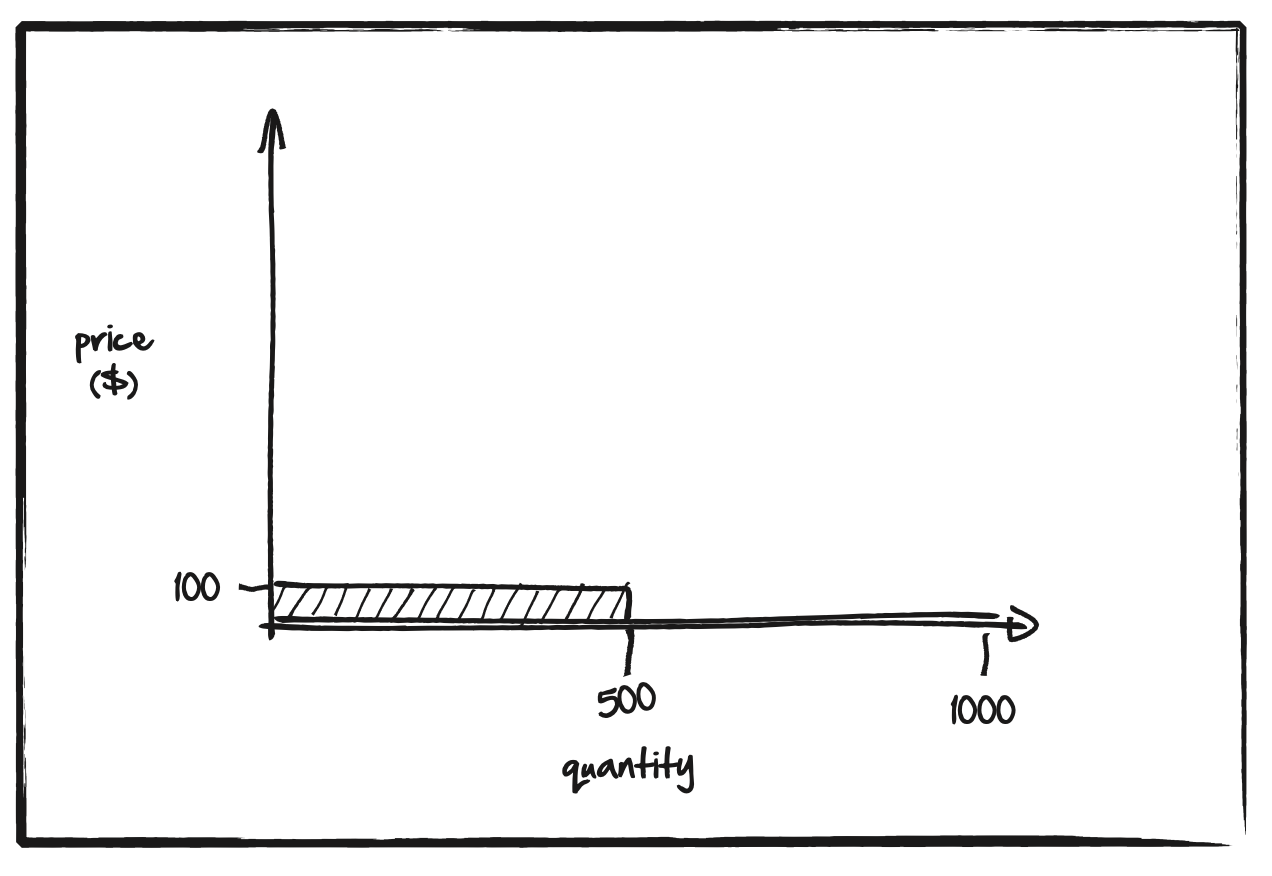
If you move away from free, and start charging $100, then the number of people prepared to buy will drop sharply. Belinda is a bargain hunter and was only using the software because it was free, and Stew is a stu- dent, so neither of them will buy. You’ll get, for the sake of argument, five hundred customers instead of the original thousand. Let’s represent that as a bar with a height of $100 and a length of 500 units. What’s the revenue you generate from this? It’s the area of the bar, so $100 x 500 = $50,000.
Let’s overlay it on top of the first bar:
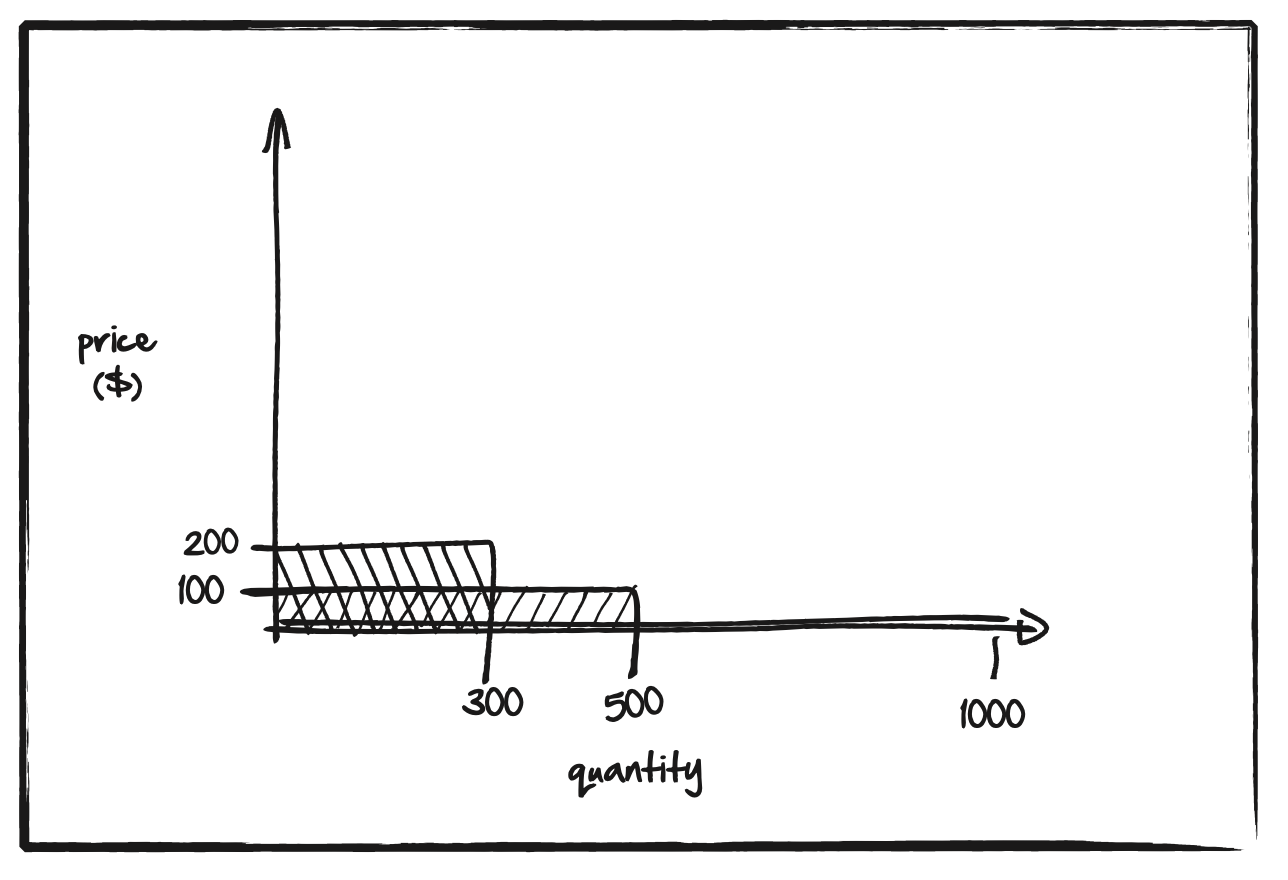
What happens if you increase the price to $200? Some of the people who would have bought at $100 will no longer buy, but some still will. Willhelm runs his own company and can’t justify the price, so he’s no longer interested. Let’s say 300 people will still buy, represent this by a rectangle and overlay it onto the chart. Again, the revenue you make from 300 people buying at the price of $200 is the area of the rectangle, so $200 x 300 = $60,000:
Let’s increase the price once more, to $500. At this point, fewer people will buy your product. Pat the product manager drops off because at that price she’d rather buy a competitor’s tool. Let’s say 50 people will still buy, and represent this as a rectangle, overlaid on the chart.
Once more, the value of this rectangle is its area: 50 people buying at $500, so 50 x $500 = $25,000.

Finally, since the Time Tracker 3000 is valuable, but not that valuable, let’s assume that nobody will buy if you price it at $1,000 and represent this as a bar of width 0 and plot it on the chart:
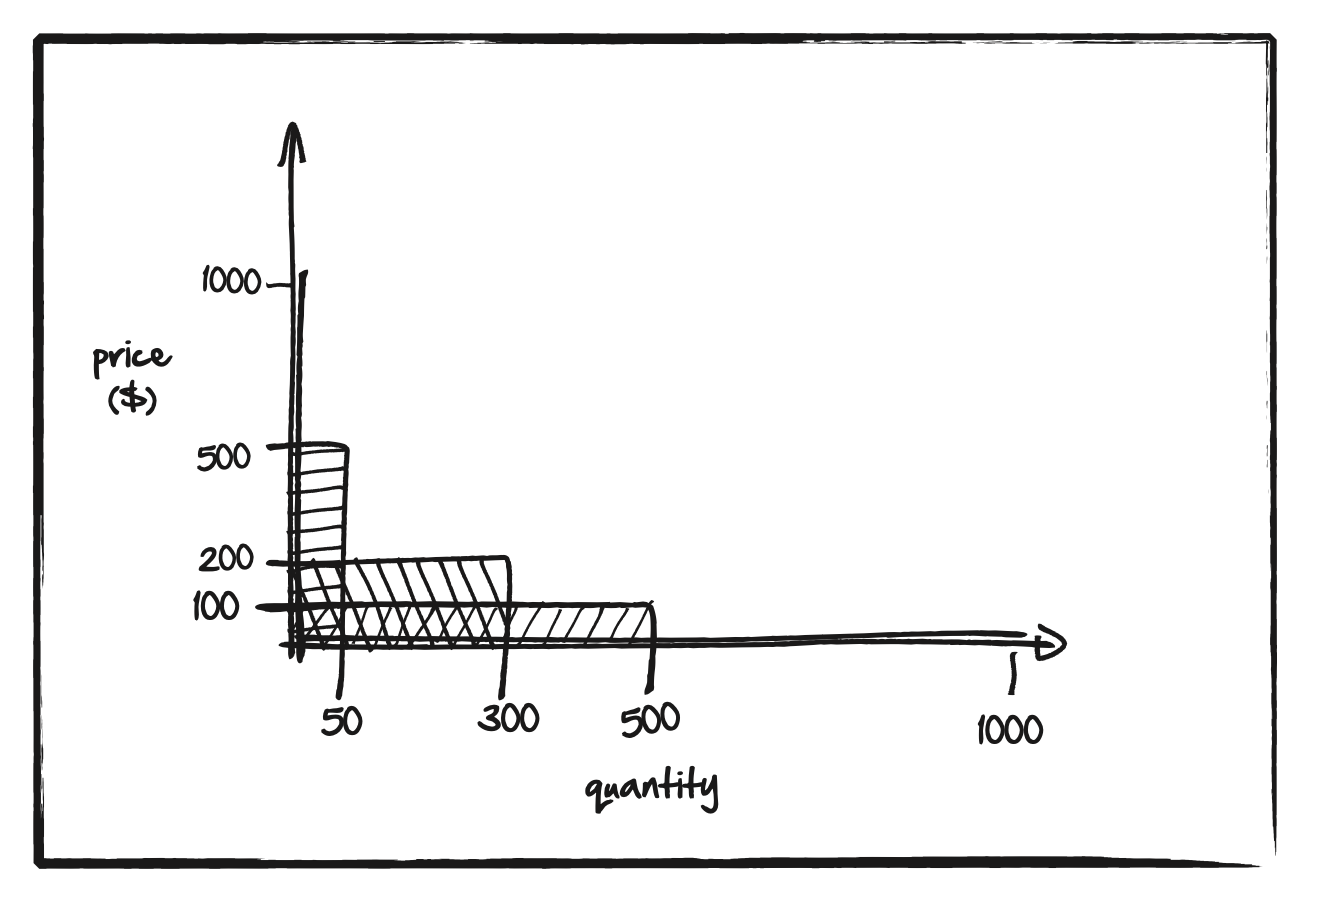
We’ve plotted five points on what is becoming a curve of price against the number of people who will buy the Time Tracker 3000 at that price. What’s more, you can work out the total revenue you will get at any particular price by looking at the area of the rectangle (price x purchasers) under that point of the graph:

Economists call this a demand curve.
To maximize the revenue of the Time Tracker 3000, we need to find a point on the graph that maximizes the size of the rectangle underneath it. To understand that, it helps to plot the area (i.e. the total revenue) against the price. For the Time Tracker 3000, this looks something like this. (I’ve plotted the five data points we’ve already got):
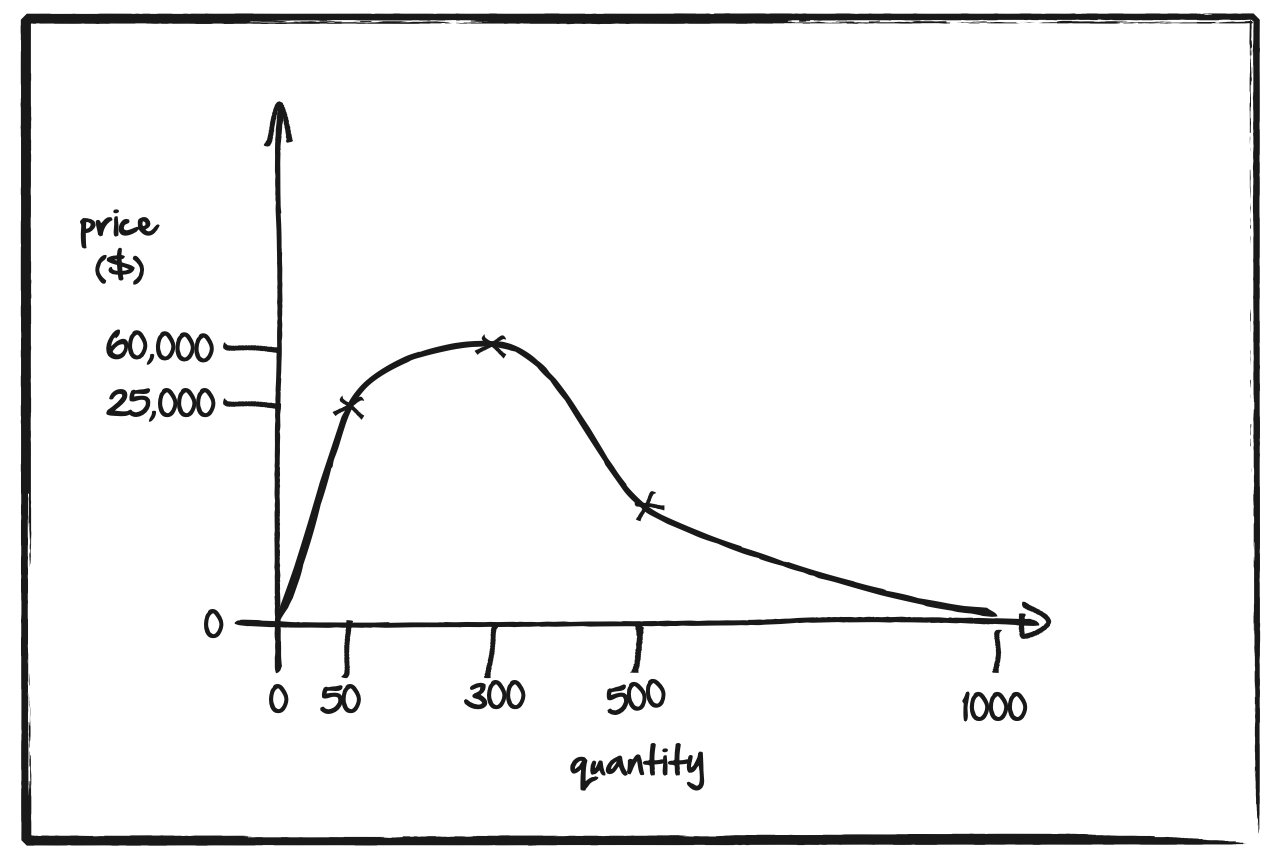
From the diagram, you can see you should price the Time Tracker 3000 at around $300. It’s not where you’ll sell the most units, but it’s where you’ll make the most money.
Plotting a demand curve is, in theory, straightforward. In practice it is way harder. In the real world, you don’t know what the shape of the demand curve is, or where your current price sits on it.
On some curves, and on some points of the curve, you’d be right to increase your prices: the reduction in the number of people buying your product will be outweighed by the increased revenue from each person. On other curves, or on other points of the same demand curve, increasing your prices will lead to a massive drop-off in sales and you’ll lose money.
What’s more, the shape of the demand curve is dynamic and depends on a bunch of factors, including your competitors, how they’ll react to any price changes they make, the amount of money your customers have to spend and the type and quality of your product.
Learn how great SaaS & software companies are run
We produce exceptional conferences & content that will help you build better products & companies.
Join our friendly list for event updates, ideas & inspiration.