At BoS Europe 2017, Vince drew on his significant experience as a data junkie to argue that we need to switch the obsession for seeking the coolest, newest predictive/learning models for an obsession with finding (usually simple) things that improve your business. There is, of course, a time and a place for fantastic, sophisticated models, but better not to start there. Vince shared some of the simplest ideas that you can use in your business to make better-informed decisions.
Find Vince’s talk slides, hangout, video, transcript, and more from Vince below.
Find out more about BoS
Get details about our next conference, subscribe to our newsletter, and watch more of the great BoS Talks you hear so much about.
Video
Hangout
Slides
Transcript
Vince Darley: Let me introduce myself while we’re waiting. So I’ve had the privilege of being in some interesting companies over the last 10 years or so, with Ocado for quite a few years, on the grocery delivery side and then for 5 years at King. I was at BoS two years ago in Cambridge. Spoke a lot about what we’ve done at King with Candy Crush as a game and all the amazing things you can do with astonishing amounts of data. Although really quite simple data, in fact. In a game like that, you don’t get the richness of data you get in a business like Ocado where you’ve got warehousing, websites and distribution and all those things. You’ve got very simple data in a very simple game.
Then just a few months ago I moved to Deliveroo for a new challenge. A bit closer, perhaps, back to the world of Ocado, in the sense that it’s an end to end operation. It’s got websites, apps, the delivery and restaurant side of things, but of course the restaurant side is not something we, at Deliveroo, have a great control over. So it’s a real challenge there and about, sort of, pulling all of this together. My role at Deliveroo has moved from the past when I was focused on data and analytics, now I head growth in Deliveroo. So it’s a mixture of product and marketing with a little bit of data thrown in so it’s a good new challenge for me. Hopefully we’ll get it working.
I’m trying to think what else I can say in terms of introduction. So I guess what I want to share with you really is a blend across my experience, across all of these things and really partitioned into three main blocks which will hopefully be a value to all of you here. So the first is about how to kind of get started with doing good stuff with data and analytics in a business to make better decisions. How to get off the ground and start doing good stuff. The second section, how to take that further. How to start enjoying the benefits of data and doing great things with it in your business and getting in the subtleties there, but also a strong message to really get the benefits of this stuff, simplicity is key. And there’s a lot of learnings that I’ve had, some in good ways, some in bad ways, over the years of cases where we’d try to do things in too clever ways and really you’re getting back to simple analysis, things, backed up with good business understanding. That’s what really drives the big benefits. But I will touch on some areas where I found there are good reasons to kind of double down and start to be more sophisticated about how you approach these things. That’s when your machine learning, recommended systems, data scientists, really come to the fore. But there’s a tremendous amount that you can do without any of that. And then the third section is about how to scale this stuff up. I’ve been privileged at King to be in a business that grew from 180 people when I joined it to 2500 when I left it, in the space of nearly 5 years. So I’ve learned a lot about scaling and what that means in terms of organisation and people you need and how you should structure them. I think a lot of that has have come out over the last couple days and I echoed a lot what I picked up from that. Ok, so I think we’ve covered that for sure so that’s good.
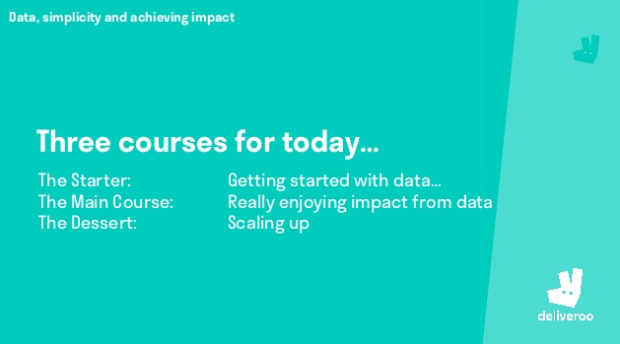
So, it’s gonna be food themed since I’m from Deliveroo so we got the starter, getting started with data. Main course, really enjoying the impact from data and the dessert scaling up. So the starter.
So I happened to do a bit of Googling earlier and I discovered that last year, a woman set the world record for a largest number of chicken wings eaten in 30 minutes. Which turned up to be 440 for anyone who wishes to take that on. Anyway, so don’t recommend that.
Getting started with data
So, getting started with data, there’s sort of 3 key pieces that come together that really need to be in place and then you can start thinking about the metric. Obviously you need some data, you need to gather some data from your apps, your website, whatever it may be. It’s often in fact, the hardest bit of those three to get right because the people who are responsible for the website, the apps, the engineers and so on, they tend to care less about the data. They want to build the most beautiful app ever, at King it’s the most wonderful game ever. And data? What’s that for? So it’s very easy to have people who are responsible for creating the data don’t care about it very much. So that’s perhaps the strongest area here which needs maybe executive sponsorship, from an on high to say it’s essential, we collect the right data and we validate it, make sure it is right and all the attributes in it are right.
We need some people, you don’t want a sort of the scientist in the corner with a lab coat on, you want someone who obviously understands data, understands statistics to some level, but it’s really someone who can reason about the business, reason about your customers, understand those things, what they want. And then they can begin to so some basic analysis to help answer a certain kind of questions. And I very much – which makes it also easier to hire those people, hiring the first of those individuals, steer clear of the sort of data wizards, find someone who you can really relate to, who can understand your business and customers. That’s easy for you to evaluate I think, as a founder of your company, and then as long as they’ve got a basic level of statistical understanding, they will be able to do some good work.
And finally you need some data systems to put this stuff in. Some years ago, it was difficult. These days, there’s a richness of possibilities there with all the big clouds out there, Amazon, Google. They do amazing stuff these days. There’s loads and loads of options there and it’s pretty hard to make bad decisions in that area now whereas it used to be quite easy to make bad decisions and we certainly at King, we were slow to take the good decisions would be the charitable way of putting it. So that brings us to pulling those together around the metrics.
Find some quick wins
So three important things that need to come together to get started there. I have to step back a little, sorry. So, take – to get started, just take some metrics that you care about. The ones I’ve put up there are perhaps on the more difficult side to approach. Customer acquisition cost, customer lifetime value are some of the most complicated things, but a lot of the operational metrics can be quite simple. And to give you an example of a really easy starting point at King where we got a lot of value, we’re simply looking at – so people install in that case it was a game. And you want to understand how long do they spend in that? And obviously you would like people to spend more time rather than less, but what you’re expect in these cases is you will get a nice distribution. There will be a few people who spend no time at all, a few who spend hours and most people are in between. That’s what’s you’d expect to see. Ignore the averages, those are misleading and I will get in that in a moment. You expect the distribution. When we looked at that for one of the games we released a few years back, we didn’t see a nice distribution like that. There was this funny double bump. One small and then the big bump. And that little bump meant there was a big peak of people who were disappearing from this game within a very small number of minutes. That just didn’t make sense and then you look a bit deeper in the data and you understand that those people despite your best efforts to explain how the game works, they didn’t understand it at all. So 10% of the people just were totally lost. And the very first level of the game, which seems impossible to fail it, they would fail it repeatedly. It was incomprehensible but that doesn’t require great sophistication, just looking at a distribution and seeing there’s something abnormal and trying to understand what would cause that. So that’s the simple thing that can really help a lot to start with.
Both at Ocado and Deliveroo, we got a lot of value out of realising that the data one gets from a post code and so on, where a customer lives, is often pretty ropey. Which seems surprising in this day and age, but it’s pretty ropey and when you think of the timescales involved and the cost of those, if you’re wasting or try to find a house and you’re having to spend an extra 2 minutes walking and wondering is it on this road or that road? It may be the dark, so you can hardly see the street numbers. You have to call the customer. You can easily spend several minutes there and that adds up quickly and there’s a huge cost. So putting in place processes to make sure you got good customer data to identify how often that happens and fix it. Doesn’t require great sophistication but can wield huge benefits, so that’s what I mean about pain points and moving beyond averages and make simple analysis around that.
The right metrics
So the one key I would say about getting the right metrics is his point about sort of moving beyond the averages, cause they hide all sorts of other stuff. And so now that very typically, for example when you’re trying to understand the performance of an app or website, one tends to focus on loading times or time to interactivity, those kinds of metrics. Really important metrics to look at, but I would strongly advise not going too overboard about reducing the averages, but rather look at the extremes, look at the 95% point and how many customers are out there with horrible experiences, where it’s taking tens of seconds for them to actually load your app or website and what’s causing that? Some of those things would be out of your control but you’d be surprised how many are areas where you can do something about it. Averages hide all these sorts of horrors, but also all sorts of opportunities. Not everything is fixable, but much of it is. So the biggest lesson it’s so easy to just have a dashboard with all sorts of averages, but the real value comes from diving inside them.
So there’s another common example of that thing, that we encountered in the past. It’s looking at sort of out of stock. So if you’re selling products, a typical thing you will monitor is what percentage of your product base is in stock at any moment in time. Sounds like a good thing to track, however that can be very misleading cause you could have 99% of your products in stock, but if the 1% that’s not in stock are the stuff your customers are caring about, then actually you have a very large problem. So you want to look at now the percentage of products in stock, but the percentage of your product views or product searches that are in stock and that will give you a better idea of how you’re serving the customer base. So this is unravelling, you don’t need great data sophistication to do this stuff, but a great understanding of the product to understand what the actual metric is that you should be looking at and if you put your thoughts in that, a very simple analysis can get you a long way.
Product Damage
And maybe one slightly deeper dive into an example of this at Ocado. So Ocado delivers maybe a couple or 2-3 million individual items a week these days in a shop about 50 items on average. And a certain percentage of those would get, the customer would request a refund on cause they were damaged in some way. And so we wanted to understand is there anything we can do about this? Obviously it’s quite a long, complex operation between the product sitting there in the warehouse and them being put in a bag, in the customer’s plastic box. That being shuffled around the warehouse on conveyors, eventually being put in a rack, loaded in a van, driver driving it to the customer, unloading it. So there’s all sort of ways, the damage could occur anywhere on that path. And the question is are there things within that that can improve? So one obvious angle to look at what who are the people involved? So we were tracking very fine grain data so we knew which person actually put the product in the bag, which person loaded the plastic crate into a rack, we knew which driver then had that rack in their van and took it to the customer. So you can look at a distribution of are there certain individuals, whether they’re drivers, loaders or pickers, they are more responsible for product damage than others? And it turns out to be that yes, it is and you can see that there are some drivers and the way in which they’re driving, you have to obviously try and correct for things like how far the product’s been driven and stuff like that, but there are some people who are driving in a very brutal fashion was the only sort of conclusion really. And you can talk to these people and show them with the data, that this is leading to so and so many pounds more of refunds every single day they work than the average driver. And you got a good discussion there that can help the driver understand that they need to drive a bit differently.
But actually the weirdest thing out of that was that there were a few individuals, just like 3 or 4 in the warehouse, who were massively off the charts of the amount of damage that they were causing, it seemed. So it was just, there was a nice distribution of people sort of typical histogram of how much damage and then there were these 3 people out here somewhere and I was like what’s going on? What are they doing? Are they throwing the products in the bags? And so we went and found one of these people to speak to them and it turned out they weren’t actually a picker at all, they were actually a manager of a section of a warehouse and mostly they weren’t involved with picking any of the products except under unusual circumstances when one of these plastic totes was running late, it couldn’t follow the normal conveyor belt route through the warehouse but instead would come down a sort of special sort of side-route which involved what’s known as a gravity conveyor which is just a big slide. And the slide ended in a very solid wall. So these things would come zooming down and would go like this. And then one of these 3 people would come on over and scan it so his or her name was attached to that thing and they’d put it on a rack. So having seen that, it was very easy to fix this gravity conveyor, to have a proper kind of damping and have them coming down gently. That’s the weird stuff that shows up when you look at the exceptions. And those things can be huge, huge difference!
I suppose the last sort of area I think we’re touching on which I think Alex touched on yesterday, I mentioned this as well in the context of the jobs to be done is also when we talk about looking through the metrics and moving beyond averages, it’s always absolutely essential to look beyond the averages of your customers and look at different kinds of customers, and in particular look at your top customers. In every single business there’s a very small percentage of customers who are responsible for the majority of the revenues and higher percentage of the profits – your best customers. You need to understand them more, understand the jobs that you’re doing for them more and there’s tremendous value in that area across every single business I’ve been in. If you don’t, there’s comparatively a small number of people so if you’re looking at averages, you can often be quite deluded to what’s important at these individuals and then before you know it you have a problem where you’re beginning to churn out because your product as you’ve evolved over time, you’ve evolved it to serve the average well which may be negative for those people. You may be serving them worse cause you’re not paying full attention to them.
Our Main Course: Really enjoying impact from data
All right, with that let’s move on to the middle section. So really enjoying the impact of data, getting a bit more sophisticated about it, so in my googling, I found there’s a world record for the longest strand of cooked pasta, which unfortunately for any Italians here, it’s not made in Italy. It was the Japanese who have the record which is 3776 meters long. So I don’t know if anyone ended up eating it, but it was very long.
Data science & analysis for actionable insight
So we’re talking about trying to get more sophisticated about these things now and also touching a bit upon how do we get this sort of analytical approach into a business, in a more substantial way. And so the purpose of looking at data and doing analytics is to take action, to make some decisions in a different way or to at least make very strong recommendations to the senior boards or the management teams or whatever it may be. Unless you’ve got a mean to actually take action, then the process isn’t gonna work very well. That means that most of the stuff that anyone who’s doing this analysis should come up with should very easily be put in action. That means as much as possible, they need to be part of teams that can take action. So really the first lesson there is don’t have some central analytical function who are consulting or advising the rest of the business because then they spend most of their time trying to sell the ideas to the business and also trying to understand them. So embed people across the business. Every product team or every metric area put in place. There’s an analytics person in that area, they care about that part of the business, they work with the engineers or designers there. And that team has the capability to act so if a data scientist comes up with something that’s valuable, it will be acted really quickly. That’s the first ingredient there.
Then there’s some complicated things. So the moment you have an analytical capability, you start to end up with endless questions. There’s always more questions than you’ve got time to answer. There’s new questions every day. Every time something goes wrong, there’s questions about why did it go so well or badly? Why is this number trending in this way? It’s a never-ending trend that needs answering. So you need someone in there who can do a good job of prioritising, saying this is important, that stuff is not. That may sound really urgent, but it’s actually not important and it’s amazing how much work can easily be done on stuff that actually never leads to any action. It leads some people feeling more comfortable, getting a bit more understanding. It’s not a daft work, understanding is good, but you can easily get sucked down this path where all you’re doing is loads of analysis to help people understand but nothing tangible is acted on upon it. So really trying, you need to make sure you do good prioritisation there.
Part of that is also – what I’ve spoken so far is about analytics being on the receiving end of things, kind of observing what’s going on, analysing and then decisions come out of that but it should be the other way around as well. So analytics should be there to help drive what areas should we be focusing on, where are the big leavers. So one of the first things I did when I joined Deliveroo is have one of the analysts there look across really sort of all the levers you got to place. So if we were to improve our customer retention every month by 3%, how big a bonus would that be? If we were to improve our customer acquisition, cost per acquisition by 5%, how big a benefit would that be? You can very easily with some assumptions, the point isn’t to be exact about these things, but you can pretty quickly look across 10 or so potential levers that you’ve got and realise these ones, we’re gonna have to make huge improvements here to have any kind of really strong measurable impact on what we care about. So these are the leavers where we have a chance. Then you can focus your engineering efforts on what can we improve in that area? Let’s do some stuff here where we have a big chance to make a big difference.
Real-time analytics? Predictive analytics?
That brings us to maybe this. So, I’m a proponent of simplicity and I talked about having the lab-coated scientist in the corner that needs to be avoided. And you need to make sure you hire the right people there. And I suppose one good rule of thumb there is every time I’ve interviewed an analytical person, I always ask them tell me about what you’ve about really enjoyed doing. And there’s usually 2 kinds of answers. There’s those that say, they start talking about this model they’ve built, clever and complicated. And then the ones who talk about how they managed to improve some part of the business and they had a big impact with something they did. Really hire the ones who talk about the impact they’ve had. It’s not to say that the ones who talk about the great model they built are people you shouldn’t hire, but you should really think carefully about it. Some of them, if they’re too overboard in that area, it’s definitely no-hire. There are cases where you need people who enjoy that stuff and want to build more sophisticated models but you need to make sure that you’re ready for having that person in the team who will have a different motivation in the mindset. You can ask people a simple question and it can help distinguish things quickly.
So in that broad area, predictive analytics, machine learning, real-time analytics all this stuff sounds great and I will take us through some stuff on why most of the time you don’t want to head in that direction, or at least you don’t want to start in that direction. You maybe can evolve in this area but just don’t start there.
The main reason for it is this. If we take the idea of predicting stuff, so churn prediction is a very standard thing that kind of we read about it and everyone wants to do it and it’s the first thing if you hire a data scientist and they want to share a predictive churn, and a lot of marketing people want to predict churn, but the problem is it’s not really much use. And it fails in one of these things. So you have to – that thing that you’re trying to predict needs to be predictable. Unfortunately, the people that you’re trying to predict, cause you always try to predict people’s behaviour, they aren’t predictable. So it’s hard to predict what people will do in the future. Let’s say you gather all your data and you build this predictive model and all the numbers come out looking pretty good and you’re confident I have a good predictive model. You then – that model, you need to be able to act with it and that’s where you probably realise you’ve built the model wrong because you when you predict churn you say I will slice up my data into the past and the future and I will pick some arbitrary moments in time so I will use data up to the 31st of March on all my customers’ behaviour to try and predict what they will do in the same month after that, in the month of April. I want to see if I can predict people in that historic data who won’t turn up in April. So they vanish. Sounds like a very sensible thing to do and that’s what your data scientists would end up building.
But when you look at what that model is predicting, you see what he’s trying to do is 100% certainty the people that it’s predicting who won’t show up in April will not have shown up in March either. So they may have been there in the past but in March they haven’t shown up. So it’s easy to predict they won’t be in April. It’s just a continuation, they churned back in February and aren’t showing up in the data. So your predictive model was structured wrongly so what you need to do is reformulate. You can’t act on that cause the person churned a month ago and it’s useless. So what you actually need to do is, you say I need a reform on the model and say for all the customers who are active on this day, how many of them can I predict are not gonna come back in the future? Now I have a much harder predictive model so I need to go back to the drawing board and I have to build a new one. It’s hard to do and it will be less accurate than the first one which is useless. Let’s say I built that and lets say it still has some value, it can still predict a bit. So now it’s actionable because I have this thing, this person is on my website, in my Apple right now and I’m pretty sure they’re not going to come back. So I can do something. And then you run into the third problem, what can you do at that stage that’s going to be very effective on those individuals. The answer is very little. The typical thing that happens is you offer them a deep discount or something and maybe it helps a bit but it doesn’t. So you end up doing loads of work and having stuff that’s very little impact at all, no sort of effect on individuals. This is the stuff that happens over and over and if you would have put that energy instead in to trying to get your existing customers to be more engaged with your product or maybe get the ones who are a little bit less engaged, the ones that they use to use my product twice a week, now it’s twice a month. You don’t need a fancy predictive model of that, a data scientist to do anything there, you can see there’s something you’re not serving those people right. What can you do there? Do something for them. Put your energy in that, in making your product more engaging for those people rather than trying to do some clever prediction which just isn’t gonna get anywhere. So those are some of the sorts of dangers that mean that I very rarely found much value out of this.
Experimentation, Experimentation, Experimentation
The thing that I really get a lot of value out is experimentation. Lots and lots of great experimentation. And I want to spend a fair bit of time on this now. And really over time I’ve seen just tremendous benefits from experimenting with all different aspects of products. You have to do it in a structured way so experiment in the areas where as I remarked a moment ago, you identified you have a chance to have a big impact. If you can improve something in that area, it will have a big impact, those are the areas you want to experiment in. And you want to be bold. And I really liked what Dupsy said earlier. You gotta take bold bets in these areas, buying big things, experiment with big things. Obviously not exclusively. Have a portfolio approach, but some effort in some low risk, low reward thing. It’s amazing how many things we’ve discovered over the years where comparatively small changes have had dramatic impacts where we were bold in the sense that most people didn’t believe those changes would have any impact at all. These are things that half the room says it’s a stupid idea, but go ahead and do some of those things. It’s amazing what you’ll discover.

At King on at least two separate occasions, we found things that had a double digit percentage improvement on the revenues of the business. Which is quite extraordinary really. And that was done through a systematic approach of taking high risk experimentation. So you need to find a way to be comfortable to take high risk experimentation. In King’s case, it was done by doing the high risk experimentation in smaller gains. So you have Candy Crush generating billions a year and then you have a small game which generates a few millions a year, do you experimentation in that small game, find stuff that works and then put it into the other games. So that’s how King managed that, but you need to find ways to enable you to do some of the higher risk experimentation. There’s really amazing stuff that you can discover in there.
There’s dangers with experimentation. Scott talked earlier about being data savvy and experiments need to have a purpose. You’re running an experiment not to test out whether this feature is any good. That’s not what it’s about. An experiment is about whether you can change your customer’s behaviour in some ways. You have a hypothesis that if I stick this feature into my product or service, that customers will change their behaviour in some particular way and that’s what the experiment is about, this hypothesis and it tells you what you should be measuring. That way you avoid to having this dashboard that Scott showed us earlier with 100s of metrics and you can delude yourself into anything looking at it. A hypothesis will have 1-2 clear metrics that you try to observe, that’s what you should be measuring.
Also to make things quick and easy, you should also distinguish between – some experiments you will run will be where your goal is to shift a business metric. This experiment, my hypothesis is if I do this, I will get customers to come back more often instead of people only using my service 3 days a week, I expect to bump that up by a reasonable percentage. That’s a tangible business metric output. But not all experiments should be of that kind. You also want to do things which are sort of earlier stage in the funnel. Find things that customers care about.
So the best example I can give of that, is what we’re doing at Deliveroo now. Food is a very social product, people all eat food, they like talking about it, you like talking about restaurants you’ve been to, about good or bad meals you’ve had. All these sorts of things. Currently, at Deliveroo, we do little to leverage that social element. And so there’s a dozen different things we could potentially do and what we’re trying to experiment with now is what or those things are things the customer cares about? What are the – do you want to review your food and maybe share that with some people? Do you want to take some photos of your food and stick it on Instagram? You know, what is it? Do you want to share a menu with a friend because you want to order together and therefore send it to them? Do you want to recommend a restaurant to someone because you’ve seen the description and some friends are going to love that place? Or is there a dish you want to share with someone? There’s so many things you can explore there and it would take us forever to build well-constructed big experiments around those things. So our goal is to just to very small targeted experiments where we’ll just stick a share button on a menu, for example. Hardly any customers will interact with the button, most people will ignore it cause it’s inconspicuous and we haven’t put it in your face. But the question is, for those who do, what effect does it have? We’re not expecting some great improvement in some business facing metric, we want to know the people who clicked on the button, how many shared something – cause you contract these things – how many new customers came back as a result? If it’s a big number, we know there’s something interesting there. Sharing menus is a value to customers and their friends. There’s an opportunity we should build on. If it’s a tiny number, it’s a crap idea, and move on to the next thing. Let the customer write a review and share that. You can just discover what things do customers care about and that’s very different from something where you try to do an experiment like what will move my business metric, it’s a precursor to that so I urge you to take advantage of these things as well.
It’s worth also pointing out experiments are great, product experimentation, ab testing are fantastic but don’t lose sight of the fact that you can answer a lot of questions with user research, talk to your customers, those sorts of things. Those can be much better ways to answer some questions you’ve got than going to the trouble of getting engineers and designers to build an ab test in your product. Make sure you use the right approach for the right thing.
So one sort of final example around metrics maybe, so sometimes metrics can be misleading. And this is a pretty good example of how metrics can be very misleading and how you can over-optimise and end up making wrong decisions as a result. So these are the first 60 levels of a Candy Crush Soda Saga which is a tremendous game it’s in the top 10-20 worldwide and has been for a couple years now. We spent about 6 months doing all sorts of experimentation on these early levels of the game, particularly the first 30 – the top half of this page. Cause those first 30 levels, that’s the onboarding. These games don’t have tutorials and it’s about getting people to the game. And there’s all sorts of things about how challenging should it be? How do you design these levels so that people who’ve been playing Candy Crush, which this game is similar to, can enjoy it and people completely new can also enjoy it? How do you balance that? How rapidly should difficulty ramp up? How spikey should difficulty be? Should you have some really easy stuff that’s fun and exciting and then have peaks of difficulty or should things be more moderate?
So we explore all sorts of stuff for months here, gradually improving metrics. The obvious one looks at here is next day retention. So of the people who installed the game today, how many came back tomorrow and keep playing? It’s a very standard metric in the gaming industry. You also look at the longer term retention. How many will come back in 7 days, 14 days? And towards the end, we had a different idea about how to change the difficulty of the levels in a way that might be more appealing which was rather than having smaller spikey difficulty to kind of raise the bar of difficulty of many of these levels. And we constructed an experiment, put this live and almost immediately we see that second day retention is down. So the people who installed the game, more of them are disappearing now that we’ve given them this harder experience. So that’s obviously bad. However, having put this experiment in place, we always tend to run things so leave them live and running so that you can learn from it. After 7 days, actually, the test and control group were pretty similar so it was a sort of – the test group had recovered in a sense and by 14 days, the test group was ahead and by 28 days it was relatively speaking about 10% ahead. So a massive improvement. That’s a huge improvement. If we’d paid attention to the early metrics, we’d have thrown out and completely missed an absolutely enormous improvement. And the reason that the second day retention figure was moving in the wrong direction is because it’s a metric that doesn’t reflect very heavily the people who will be the customers of this game. So it reflects all these random people you managed to get to install the game, many of whom don’t know what they’re getting themselves into, they don’t know if they will like it or not. Most of them won’t stick around anyway. And so by having that harder experience, you more quickly got rid of the people who won’t become your customers anyway but you gave the others a more fun, compelling experience which means they stuck around for longer. A metric like 2nd day retention overweighs some people who are not your customers, whereas the longer term metrics overweigh the people who are your customers. That’s often the case, that you’ll have different metrics in your business, some of which are very strongly representative of your core customer base and others which are much less so and you need to be careful not to take the wrong decisions as a result.
Know your metrics
So maybe just a couple of last comments on metrics, just to touch the basis. You know, some metrics are crazy noisy. Typically the financial ones, because it’s annoying since everyone cares about them more. At Ocado for example, if you just randomly sliced all the customer base in two, and looked at the difference in average basket size between those two apparently completely random slices, you would typically get about a 50p a basket difference. It’s very hard to run any kind of experiment and measure an outcome that is smaller than 50p difference and your expectations of the impact of your experimentations is less than 50p. So you have a problem there. It’s not insurmountable, you need to get more sophisticated about how you construct experiments. It’s a typical example and you need to understand beforehand how large an effect you will be able to observe over what period of time? That will depend upon the variation you see in your metrics. That’s something that reasonably competent analytical person can calculate for you quickly with a bit of data. Unless you know that upfront, lots of experiments you do will be set for failure because they will never be able to give you a statistically significant result that’s needed. You will save a lot of wasted time if you know that sort of stuff upfront. And equally, there are some metrics that are really quick to measure. Typically, they are less valuable, like the second day retention value I measured. They are the metrics which are slower to measure that are more valuable and that’s one of these unfortunate trade-offs in life that you have to suffer with.
Engagement then Retention then Monetisation
It’s worth pointing out that a good rule of thumb if you’re struggling with understanding what’s going on with experiments, is that I’ve found over and over again that engagement is sort of what matters. In the early days at King, we really cared about monetisation, but all the big impacts we found were always on this end of the equation. If you get people to enjoy your game more, that leads to stronger retention and monetisation. So the enjoyment and usage of your product is what matters and if you can get people to enjoy and use your product, you can work out down the line how to turn that into greater revenues, even if it doesn’t immediate lead to that. That’s key. Obviously we have to be a bit careful with that in terms of how you’re measuring engagement. It’s minutes a day, days a week, some of them metrics can be quite misleading and move in the wrong direction if you’re not careful. You can mess up your product and people spend more time in your product cause they’re confused and can’t find things. So you need to be careful but in general I would say if the situation is murky and foggy then trust this stuff more than anything else and it tends to be less noisy than everything else as well.
So quick thought about doubling down on things. This is the checkout at Ocado. For those of you who are Ocado customers, you’re familiar with this. These wonderful pages of things you’re offered when you are trying to checkout. And they are a mixture of stuff like have you run out of, did you forget? Very simple algorithms originally, stuff that’s not in your basket today. And you know, we observed in all these different sections how much incremental revenue do we get from these different sections, and then we began to tweak the algorithms behind them. The obvious thing to do would be to run loads of data through some complicated recommendation system to decide what sort of things might you like that you should put in this section here. And we chose not to do that and we did some very simple things which is for a lot of these things over here which are try something new, special offers, we said let’s just look at what products are selling heavily right now which are not normally selling heavily. So which products have had an upsurge in sales over the last few weeks? Those seem like the things that many customers like. If you’re not buying that, maybe you would like that. And that worked amazingly well and captures a lot of very complicated things. So if strawberries are suddenly in season, then they will just emerge naturally in that process. You’ll see loads of people are buying strawberries, so if I’m going to put any surging products in here then strawberries will show up and all the customers therefore will be automatically exposed to seasonal things. Where otherwise you would have thought – if you want to think how am I gonna get exposed customers to see seasonal products? You’d think I have to do some complicated analysis and multi years data and spot around this date this product comes in. You don’t need any of it. You can just use your customer’s data to tell you. You know, strawberries are selling more now, put them in here!
So all of these sections started really simply and when we saw how effective they were, we said ok now let’s double down a bit and now start to get a bit more sophisticated about these things and start building some kinds of personalisation into this. So we did indeed begin to segment customers. There are customers who are home chefs so we created a category for home chefs. And then we looked to do the recommendations and for this kind of section, for those people, we looked purely at the behaviour of other home chefs rather than everyone. All these things kept giving us incremental benefits in all of these areas. And so much so that you know, it was probably a whole year that we had a couple people working to continually improve this. And we called it the gift that kept giving because every new idea you had you could get an extra 10-20p on average on the basket by doing something in here. So it’s great stuff.
We also discovered something really weird in this whole area which shows again why you need to be data savvy and keep you thoughts about you. So the last page not shown here, before you commit to spending your money it shows you your whole basket. Here it is, everything you have in your basket. Typically 50 things. That page when we looked at the data was a negative on the revenue. So the typical customer when they see that page would remove things from the basket. That’s not very good, we don’t want that. Should we hide the page away? That wouldn’t be nice to the customers though. So, fortunately, we chose to dive deeper in the data and we realised what was happening on that page. Many customers were indeed removing things from the basket on the page, but they were also clearly being reminded of something else cause they would go back in the shop, abandoning the checkout and adding other things. And then going back through this whole process to checkout. And when you took account of what we call back to shop basket changes, there was a net negative on the page itself, but the net positive on the back to shop was larger than that. So that page was positive, it was hidden in the overall customer journey. So that was satisfying, it could be a win-win situation for everyone. It shows another example of that if you don’t take the time to think clearly about what the data really means, you can easily draw wrong conclusions from things.

Our dessert: Scaling up
All right, I’m gonna just – I will skip over this cause I’m running out of time and move to the last course. The dessert of scaling up. So this is something that I’ve seen and heard of regularly happen and I’ve been part of this journey on at least one occasion and it’s a bad journey. So by and large, don’t follow this arrow! It’s a very natural arrow to follow so you’re small, you get a couple of sort of data and analytics people and you start here and then you realise you need some more and then you begin to build these functional teams which I’ve said don’t do that! This is what we did. And pretty soon you grow more and there’s more specialisation and you split your data engineering and you get all these other teams product analytics, strategy analytics, all this stuff. And you have these different teams and what happens when a part of the business needs something done? They throw requests into one of these, maybe they need some new reporting to BI team, and they need some work done by someone else. And you got this cascade back and forth and the first time it isn’t quite right and you go back and forth and before you know it, it’s taken you 6 months to solve that particular request that came in. Complete disaster! The person who requested it has lost all sanity or will to live by that point anyway. So distributed teams is the way to go and as much as possible, avoid centralised teams of any kinds. You obviously need something/someone to kind of keep the lights on, make sure that your reporting platform is working but as much as possible, ideally just say, have the distributive people take that on. And say 1-2 days a week you can do the specialised central jobs but the rest of the time you’re embedded and serving that part of the business. That way, all of those analytics data people understand the part of the business they’re in, they have great working relationships and work on problems that matter as opposed to stuff that doesn’t matter. They get the answers right the first time, everything has much faster impact and just tremendously fast! So as much as possible, skip from there to there and avoid these bits in the middle. They are not good.
And in general I would say you may end up in some part of this journey at some point for some reason or another. The lesson I’ve learned is when you start seeing trouble, take action immediately. Trying to get a structure that doesn’t work very well to work well is not good. Turn it into a structure that you think will work well and do that earlier rather than later. So, that’s just the sort of key piece there really.
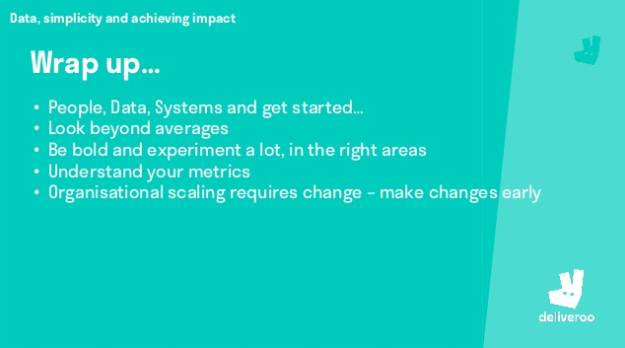
And I think with that, quick wrap up of what I thought were maybe some key messages throughout that.
• It’s simple to get started;
• look beyond averages is absolutely essential;
• be bold and experiment a lot, but make sure you experiment in areas which have the potential for big impact;
• Really understand your metrics and;
• organisational scaling does require change. Make those changes early, try to be distributed and embedded.
And with that, thank you!
Find out more about BoS
Get details about our next conference, subscribe to our newsletter, and watch more of the great BoS Talks you hear so much about.
Vince Darley

Vince draws on 20 years of experience solving complex data problems. As founder of Eurobios, Head of Data Analytics at Ocado and most recently, Chief Scientist at King.com (Candy Crush etc) Vince has built and runs a team of over 100 data scientists managing over 160 Hadoop Nodes – Big Data by any measure.
Learn how great SaaS & software companies are run
We produce exceptional conferences & content that will help you build better products & companies.
Join our friendly list for event updates, ideas & inspiration.